 Radiation
Watch
Radiation
WatchRadiation
Watch
Station - TYNGS3
Background NORM ~20CPM
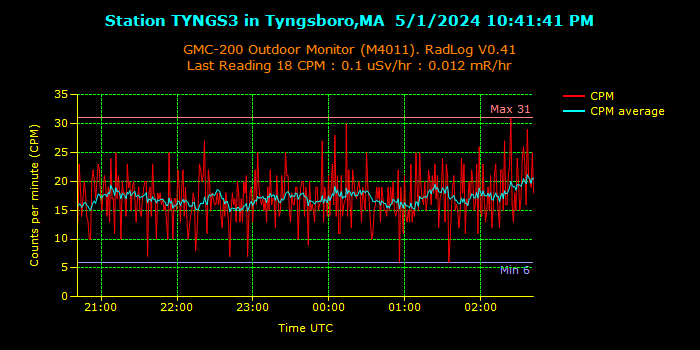 |
Chart and images above generated by Radlog, data uploaded to Radmon.org site using our own geiger counters bought or built by members of this site.

Radmon.org is a place for experimenters, enthusiasts and background radiation monitoring. You can send background radiation readings from a wide range of geiger counters, home built or kit built or some commercial counters. We welcome high CPM experiments, your own station news - if it interests you then it interests us! You can send data via the windows application RadLog, the python script pyradmon, by BASH script and by your own code. You can put graphs and current reading indicators on your own website. Put yourself on the live map with your own radiation monitoring station! Put yourself into experiment mode and let everyone see your data. Use your geiger counter for a useful purpose to monitor background when it is not in use. RadLog has many useful features, data sharing to other users, FTP and email functions, check it out on the Download page.
Disclaimer: Tyngsboro Weather and Research, the operator of this web site, and the operators of RadMon can not independently verify that the Radiation Levels, or any Radiation Alerts that are displayed on these Radiation Maps are correct and valid. Among other possibilities, Geiger counter malfunctions, proximity of the counters to certain medical procedures, radioactive items and natural ocurring background levels (Ex: Radon) can cause high readings at a Monitoring Stations. "Always refer and rely on your local Radio and TV stations for information"
![]()

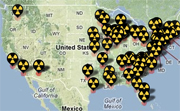
Click on symbols for more info
RSOE EDIS - Emergency and Disaster Information Service
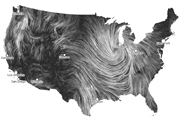
Weather Model - Global Jet Stream Wind
* How to get or build a geiger counter *
updated: 01/15/2023